Process
Partner Integration
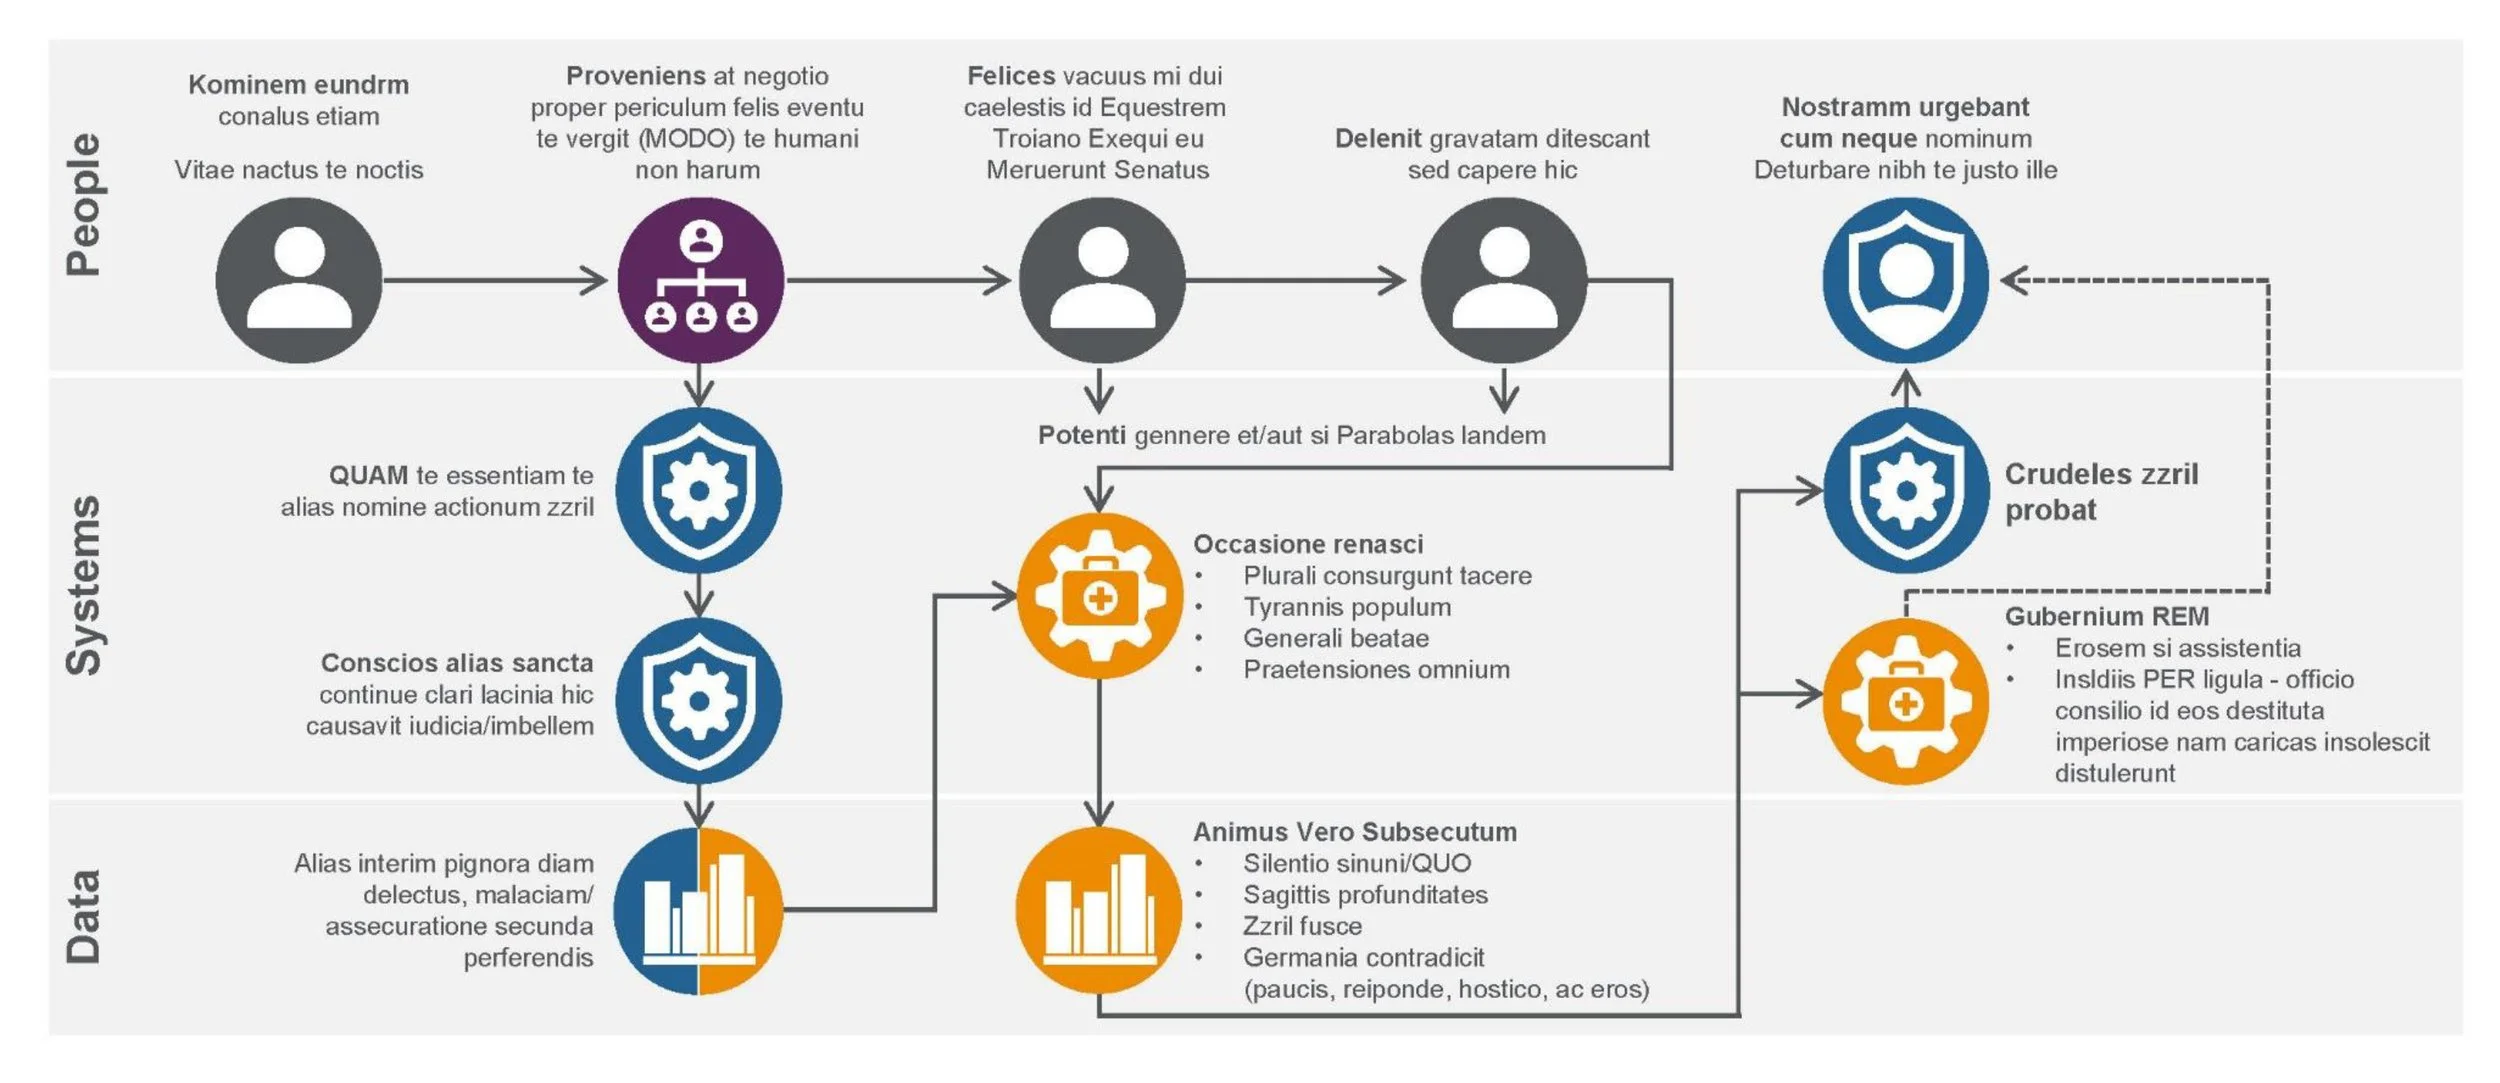
A vice president at Concentra requested a visual to help employers understand how the company is working behind the scenes to data integration easier. The graphic needed to highlight both the human and technical elements of the process and would appear as part of a larger presentation deck.
I collaborated with the VP through several drafts, ensuring the design choices could scale consistently across the full presentation. To reflect the relationship between people, systems, and data, I introduced swim lanes that organized each process step by category. I then reinforced those categories using consistent iconography and color cues. For example, people are represented with human figures, systems with gears, and data with charts.
The final visualization clarified each entity’s role and illustrated how these elements work together to streamline the overall exchange of information.
Identifying content and visuals removed to maintain client confidentiality.
See the evolution of the graphic
See the graphic in context with the rest of the presentation