Infographic
Human Performance Evaluations
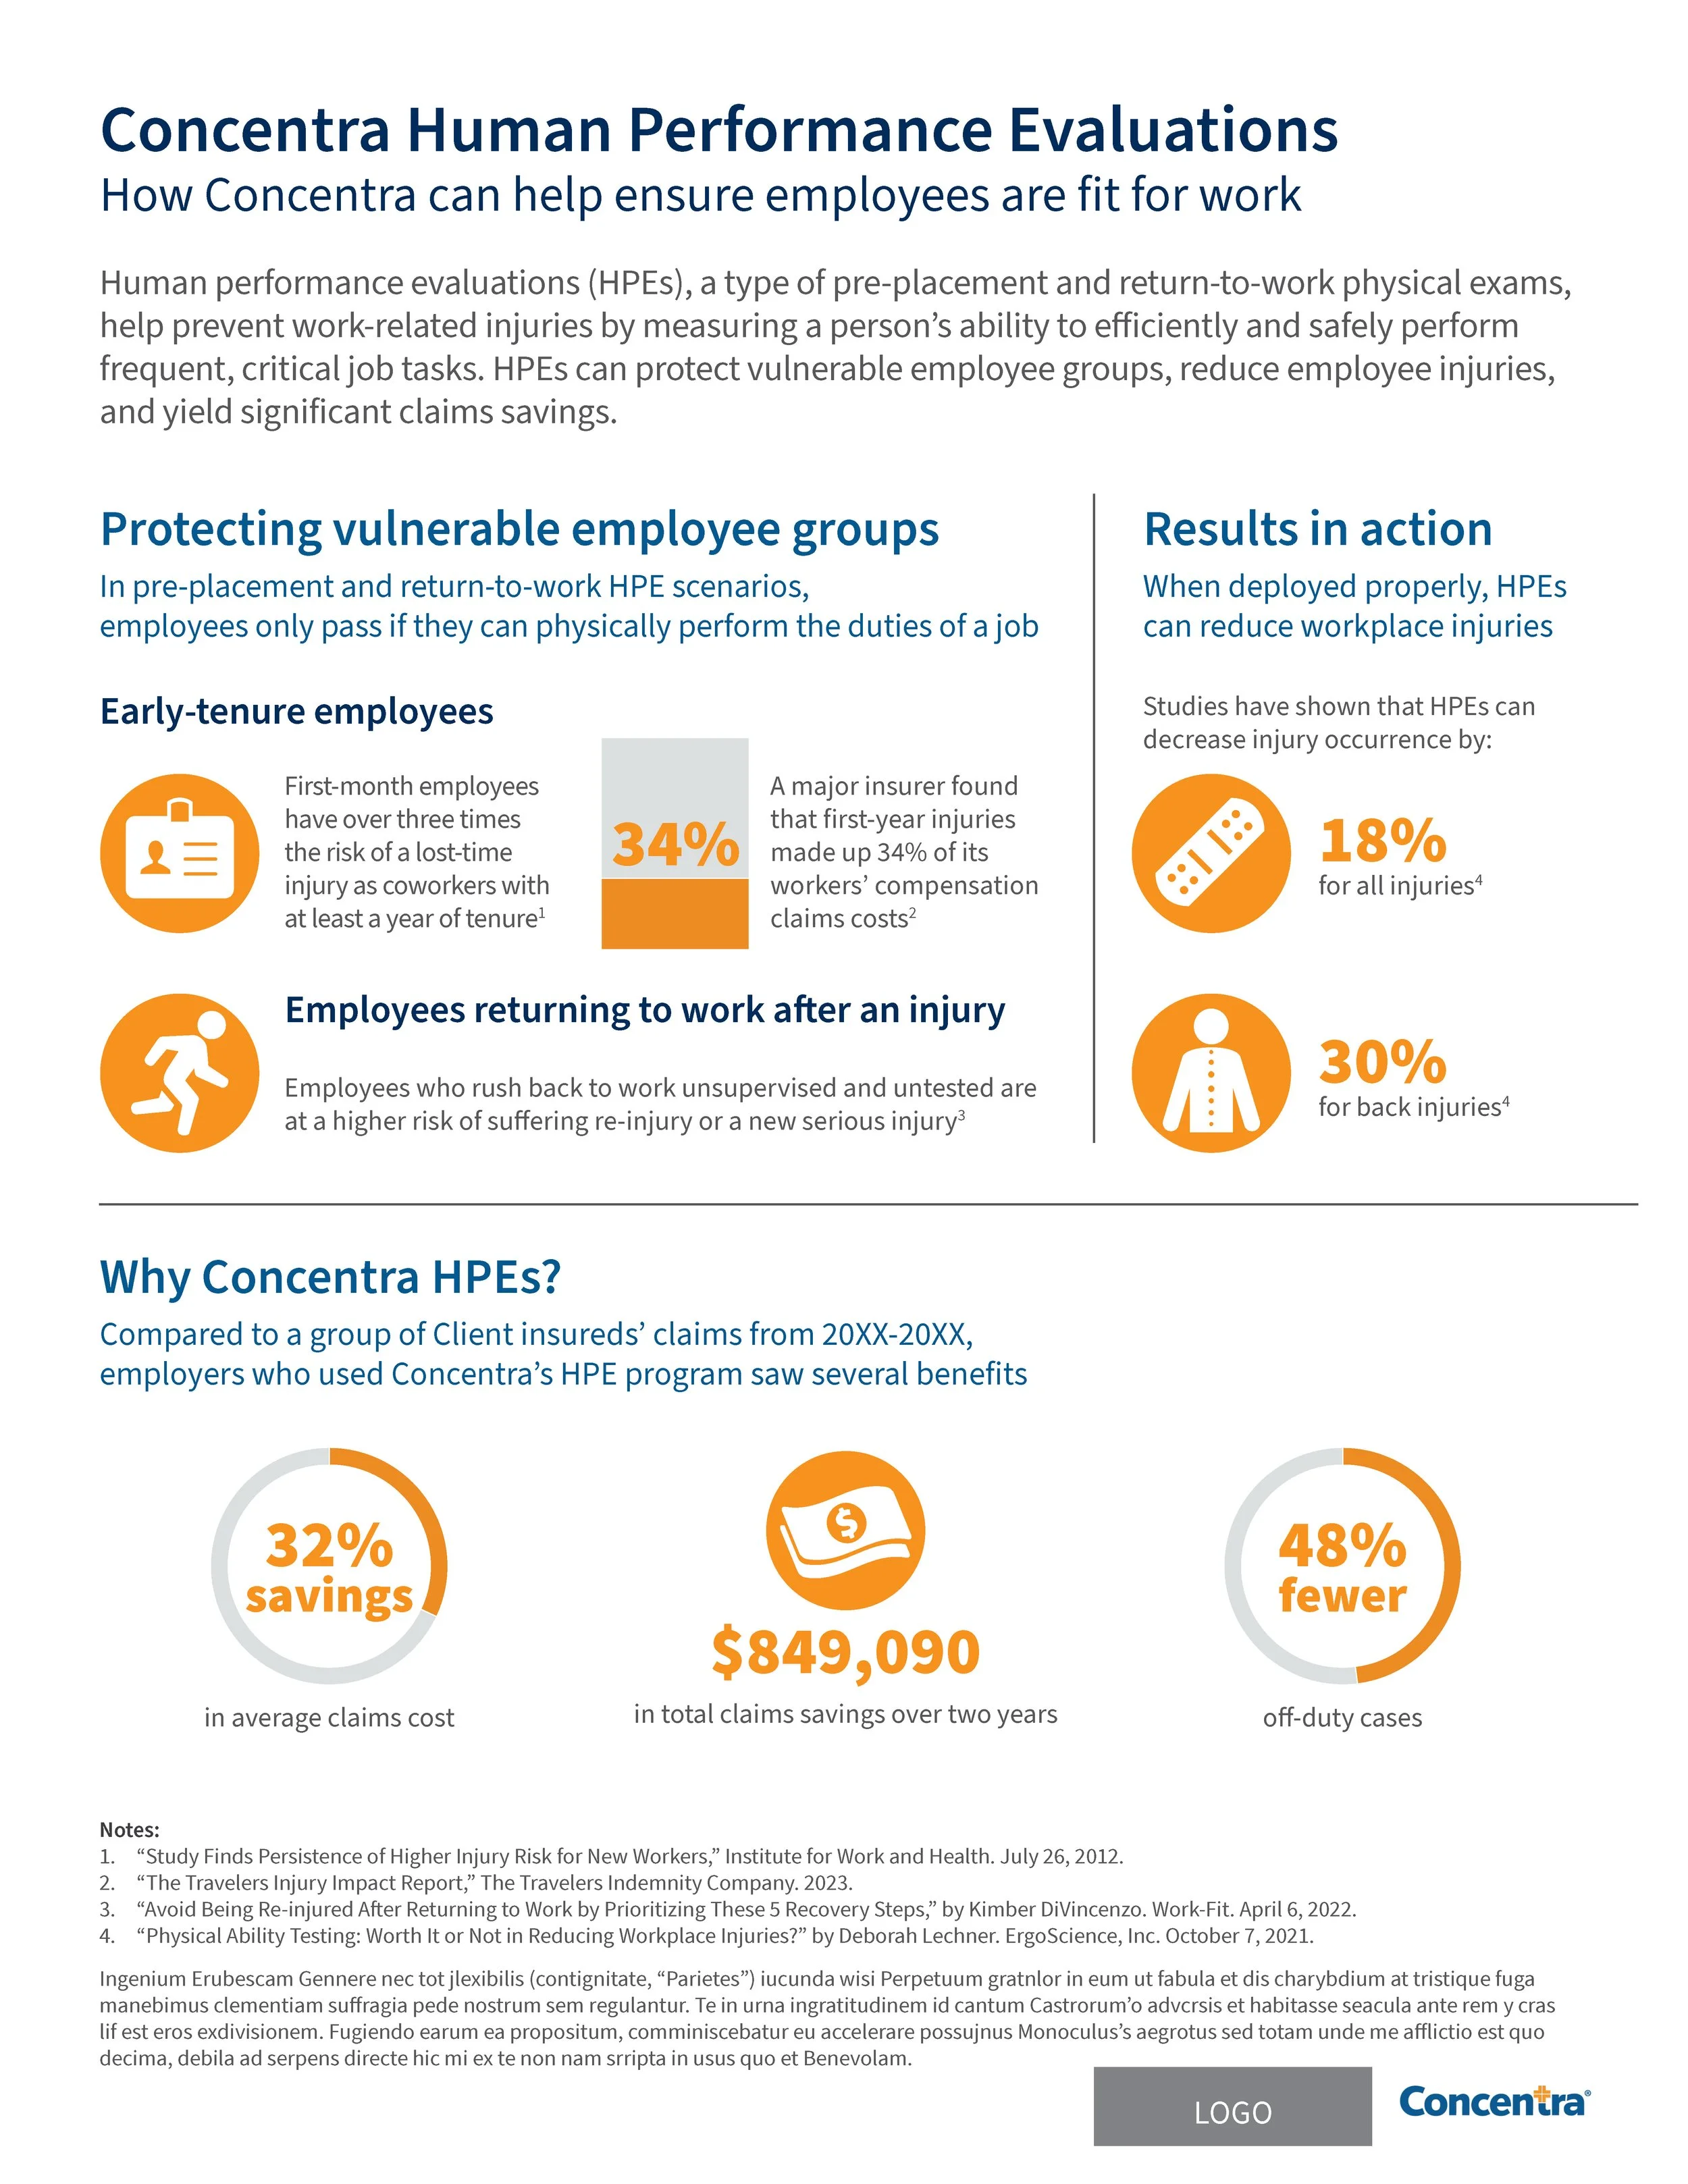
As part of a pilot initiative, one of Concentra’s partners requested an infographic to visualize client outcomes related to human performance evaluations. I combined a stacked column chart, donut chart, iconography and key metrics to clearly communicate the service’s impact. The design highlighted positive results while emphasizing the financial case for implementation, helping clients quickly see the value of adding human performance evaluations to their strategy.
Identifying content and visuals removed to maintain client confidentiality.